The unit economics of quick commerce determine whether a 10-minute delivery business becomes profitable or burns cash endlessly. While quick commerce companies attract customers with speed and discounts, sustainable growth depends entirely on understanding cost per order, contribution margin, and operational efficiency at the micro level.
After 15+ years working across retail, grocery operations, e-commerce, and last-mile delivery since 2013, I’ve seen one consistent truth: speed attracts customers, but unit economics decides survival.
In this detailed guide, I will break down the real numbers, cost drivers, operational challenges, and profitability levers that define the unit economics of quick commerce.
What is Unit Economics in Quick Commerce?
Unit economics measures the direct revenues and costs associated with a single order — essentially, “does this one order make money on its own, before overheads?” In quick commerce, this is the single most scrutinized metric because the model depends on hyperlocal dark stores, fast delivery fleets, and thin basket sizes — all of which pressure margins in different directions.
Unit economics refers to the revenue and cost structure per individual order.
The core formula:
Unit Economics = Revenue per Order − (Cost of Goods + Delivery Cost + Packaging + Discounts + Platform/Tech Cost)
If this number is positive, the order is profitable at the unit level (even if the company overall is still burning cash on growth, marketing, and dark store expansion).
Delivery Cost Per Order in India: ₹40–₹80 Breakdown
Delivery cost is the single largest variable cost in quick commerce, and it’s the most searched number in this space. Based on industry estimates and reports (Redseer, company disclosures, and analyst notes), delivery cost per order in India’s quick commerce sector typically falls in the ₹40–₹80 range, depending on:
| Factor | Impact on Delivery Cost |
|---|---|
| Distance from dark store to customer | Longer distance = higher cost per order |
| Rider incentive structure | Peak-hour surge pay increases cost |
| Order density (orders per rider per hour) | Higher density lowers per-order cost |
| Dark store location (urban core vs suburban) | Urban core = lower delivery cost, higher rent |
| Fuel/EV costs | EV adoption is gradually lowering this cost band |
Typical breakdown of the ₹40–₹80 delivery cost:
- Rider payout: ₹25–₹45
- Fuel/vehicle maintenance: ₹5–₹12
- Dark store handling & packing labor: ₹8–₹15
- Insurance, tech, and platform overhead allocation: ₹5–₹10
Companies aim to bring this down through order batching (multiple orders per rider trip) and micro-fulfillment density — the more dark stores per square kilometer, the shorter and cheaper each delivery becomes.
In simple terms:
Profitability = Revenue per order – Total cost per order
In traditional retail, profitability is store-based.
In quick commerce, profitability is order-based.
Each 10-minute delivery must:
- Cover picking & packing cost
- Cover last-mile delivery cost
- Cover dark store overhead
- Cover tech & platform cost
- Still leave contribution margin
If even one layer is inefficient, the entire model collapses.
Average Order Value (AOV) in Q-Commerce
AOV is the second lever in the unit economics equation. In Indian quick commerce, AOV typically ranges between ₹300–₹450, though this varies by platform and city tier. This is notably lower than traditional e-commerce AOV, because quick commerce is built for small, frequent, top-up purchases rather than planned bulk shopping.
Why AOV matters so much here: if delivery cost is ₹40–₹80 per order and AOV is ₹350, delivery cost alone can represent 11–23% of order value — an extremely thin margin band compared to traditional e-commerce, where delivery cost is a much smaller percentage of a larger basket.
This is why most platforms enforce minimum order values (often ₹99–₹149) before waiving delivery fees — it’s a direct lever to protect unit economics.
Why Unit Economics of Quick Commerce Is So Critical
Quick commerce operates on:
- Low average order value (AOV)
- High operational intensity
- Hyperlocal infrastructure
- Thin margins
Unlike traditional e-commerce, you cannot rely on:
- Large cart sizes
- Cross-city fulfillment
- Cheap warehouse cost
- Long delivery windows
Instead, the model demands operational precision.
Core Components of Unit Economics of Quick Commerce
Let’s break down the major components.
1. Average Order Value (AOV)
AOV is the revenue generated per order.
Typical quick commerce AOV in India:
₹350 – ₹600
Lower AOV means:
- Higher cost pressure per order
- Limited room for discounting
- High sensitivity to delivery cost
Operational Insight:
Increasing AOV by even ₹50 can significantly improve contribution margin.
2. Gross Margin
Gross margin comes from:
- Product margin (15–25% in grocery)
- Private label margins (25–40%)
- Category mix optimization
Categories with better margins:
- Snacks
- Beverages
- Personal care
- Private label essentials
Low margin categories:
- Staples
- Fresh produce
- Dairy
Margin mix directly impacts the unit economics of quick commerce.
3. Picking & Packing Cost
Dark store operations include:
- Staff salaries
- Equipment
- Rent
- Utilities
- Inventory carrying cost
Picking cost per order usually ranges:
₹15 – ₹30
Packing cost:
₹10 – ₹20
Total handling cost per order:
₹25 – ₹50
Operational reality:
High SKU complexity increases picking time and cost.
4. Last-Mile Delivery Cost
This is the largest cost component.
Includes:
- Rider payout
- Incentives
- Fuel / EV charging
- Insurance
- Fleet management
Average last-mile cost:
₹40 – ₹70 per order
Delivery radius directly affects cost:
- 2 km zone = lower cost
- 4 km zone = higher SLA risk + cost
This is where most quick commerce companies struggle.
5. Technology & Platform Cost
Includes:
- App development
- Cloud infrastructure
- Routing algorithms
- Customer support tech
While this cost is distributed across orders, it still impacts unit economics when scale is low.
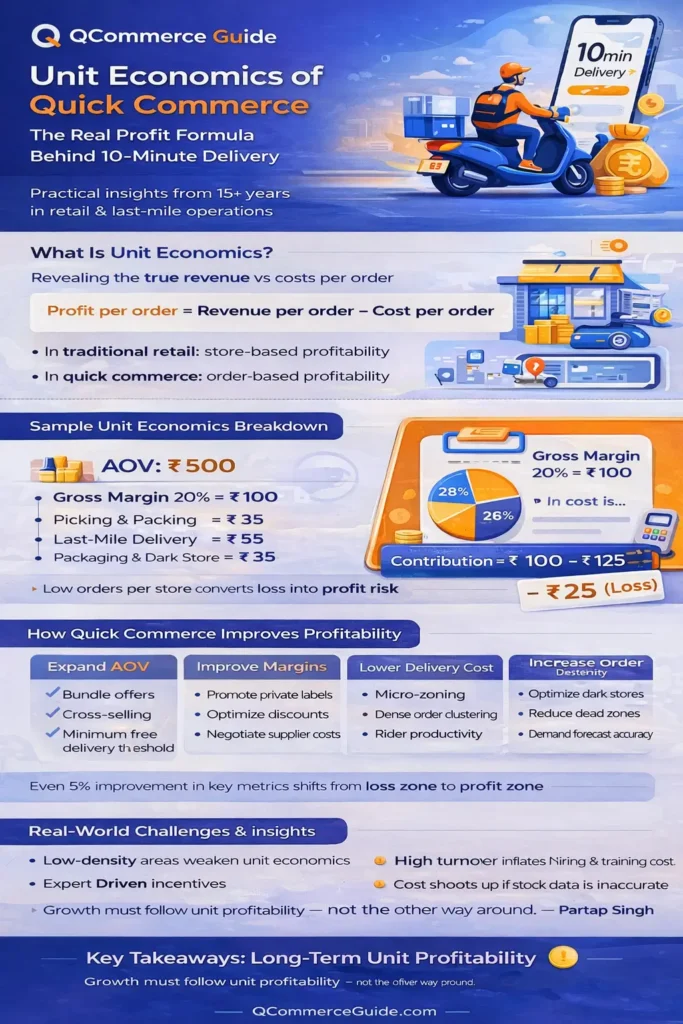
Sample Unit Economics Breakdown (Illustrative)
Let’s assume:
AOV: ₹500
Gross margin: 20% → ₹100
Costs:
- Picking & packing: ₹35
- Delivery: ₹55
- Packaging material: ₹15
- Dark store overhead allocation: ₹20
Total cost: ₹125
Contribution per order:
₹100 – ₹125 = -₹25 (Loss)
This is why many quick commerce startups initially operate at a loss.
How Companies Improve Unit Economics of Quick Commerce
Improvement happens through operational discipline.
Average Order Value (AOV) in Q-Commerce
Increase AOV
- Bundle offers
- Cart value threshold for free delivery
- Cross-selling
- Category upselling
Improve Gross Margin
- Promote private labels
- Reduce dependency on low-margin staples
- Optimize supplier negotiations
Reduce Delivery Cost
- Micro-zoning
- High order density
- Rider clustering
- Smart batching
Improve Dark Store Productivity
- SKU rationalization
- Fast-moving SKU pre-pack
- Pick-path optimization
Each 5% efficiency improvement matters.
Customer Acquisition Cost (CAC) Per Customer
CAC in Indian quick commerce is one of the more opaque numbers, since it blends performance marketing spend, discounts, and free-delivery promotions used to acquire first-time users. Industry estimates place CAC per customer somewhere in the ₹100–₹400 range, varying heavily by city tier and competitive intensity at the time of acquisition.
Key CAC dynamics specific to this sector:
- Metro markets (Delhi NCR, Mumbai, Bangalore) tend to have higher CAC due to intense multi-platform competition
- Discount-led acquisition (first-order-free or heavy first-order discounts) inflates short-term CAC but is often justified against projected customer lifetime value (LTV)
- Repeat order rate is the real determinant of whether CAC pays back — quick commerce depends on high purchase frequency (multiple times per week for engaged users) to recover acquisition cost within a reasonable payback window
Practical Insights from Industry Experience
Over the years managing retail and last-mile operations, I’ve seen several real-world patterns.
1. Density Beats Speed Marketing
Companies focusing only on speed struggle.
True profitability comes from:
- High order density per dark store
- Optimized rider utilization
- Stable demand forecasting
Without density, unit economics collapse.
2. Inventory Accuracy Impacts Margins
Inventory mismatch leads to:
- Order cancellations
- Refund cost
- Wasted rider effort
- Customer churn
Even a 2% inventory inaccuracy can damage profitability significantly.
3. Expansion Kills Economics if Premature
Opening dark stores too fast:
- Increases rent burden
- Reduces order density
- Raises cost per order
Sustainable growth requires zone-wise profitability tracking.
4. Rider Churn Increases Hidden Costs
Frequent rider turnover means:
- Training cost
- Lower productivity
- SLA risk
- Incentive pressure
Retention programs improve economics more than incentive wars.
Real-World Scenario: Profit vs Loss Zone
Zone A:
- 1,200 orders/day
- 2 km coverage
- High repeat customers
- Private label penetration 18%
Result: Positive contribution margin.
Zone B:
- 450 orders/day
- 4 km coverage
- Heavy discounts
- Low margin mix
Result: Negative contribution margin.
The difference is not speed — it is density and discipline.
Key Metrics to Track in Quick Commerce
To maintain healthy unit economics of quick commerce, track:
- Contribution margin per order
- Cost per delivery
- Orders per dark store per day
- AOV trend
- Category margin mix
- Rider productivity (orders/hour)
- Order cancellation rate
- Customer repeat rate
If these are not tracked daily, losses accumulate silently.
The Role of Scale in Unit Economics
Scale improves:
- Fixed cost absorption
- Supplier negotiation power
- Tech cost distribution
But scale without efficiency multiplies losses.
Growth must follow unit profitability — not the other way around.
Long-Term Sustainability Strategy
For quick commerce to become sustainable:
- Focus on hyperlocal dominance
- Improve private label mix
- Use AI for demand forecasting
- Optimize micro-zone operations
- Reduce dependency on heavy discounting
The future belongs to companies that master micro-economics, not marketing hype.
Profitability & Margins: 2024 vs 2025 Comparison
The quick commerce profitability story has shifted meaningfully between 2024 and 2025:
| Metric | 2024 | 2025 |
|---|---|---|
| Delivery cost per order | Higher end of ₹40-80 band, less optimized | Trending toward lower end via density gains |
| Dark store density | Expanding aggressively (growth-first) | Consolidating around high-performing micro-markets |
| Contribution margin | Often negative or breakeven per order | Increasing number of dark stores hitting positive contribution margin |
| AOV | Slightly lower, discount-heavy | Gradually rising as platforms push cross-sell and bundling |
| Focus | User acquisition & market share | Path to profitability, EBITDA discipline |
The overarching 2025 trend across major players is a shift from growth-at-all-costs to contribution-margin-positive operations at the dark store level, even as company-wide profitability (after marketing and corporate overhead) remains a longer runway for most players.
Quick Commerce Unit Economics: Full Summary Table
| Component | Typical Range (India, 2025) |
|---|---|
| Average Order Value (AOV) | ₹300 – ₹450 |
| Delivery cost per order | ₹40 – ₹80 |
| Customer Acquisition Cost (CAC) | ₹100 – ₹400 |
| Minimum order value threshold | ₹99 – ₹149 |
| Contribution margin per order (mature dark stores) | Low-single-digit % to modestly positive |
| Dark store payback period | Varies widely by city tier and density |
Note: These figures are directional industry estimates compiled from public reports and analyst commentary, not official company disclosures — actual numbers vary by platform and are not always publicly disclosed in full.
How Blinkit, Zepto & Instamart Compare on Unit Economics
While exact internal numbers aren’t publicly disclosed by any platform, the broader competitive dynamics shape unit economics differently for each:
- Blinkit has leaned into dark store density in metro markets and advertising revenue (a growing, high-margin line item that supplements order-level economics)
- Zepto has pushed aggressive 10-minute delivery positioning, which requires tighter dark store placement and potentially higher fulfillment cost per order, offset by strong order frequency
- Instamart (Swiggy) benefits from cross-platform synergy with Swiggy’s existing delivery fleet and customer base, which can lower blended CAC
The overall market (per Redseer and other industry trackers) has consolidated around these three as the dominant players, with market share shifts closely tied to who manages the delivery-cost-to-AOV ratio most efficiently.
What is the delivery cost per order in Indian quick commerce?
Delivery cost per order typically ranges between ₹40 and ₹80, depending on distance, rider incentive structures, and dark store density in a given area.
What is a good AOV for quick commerce in India?
Most platforms operate in the ₹300–₹450 AOV range, with minimum order value thresholds (₹99–₹149) used to protect margins on smaller baskets.
What is CAC per customer in quick commerce?
Customer acquisition cost is estimated in the ₹100–₹400 range per customer, varying by city tier, competitive intensity, and the scale of first-order discounts used.
Is quick commerce profitable in India in 2025?
Individual dark stores in mature, high-density markets are increasingly reaching contribution-margin-positive status in 2025, though company-wide profitability after marketing and overhead remains a work in progress across most major players.
How is unit economics calculated in quick commerce?
Unit economics is calculated as revenue per order minus the cost of goods, delivery cost, packaging, discounts, and allocated platform/tech costs — the result shows whether a single order is profitable on a standalone basis.
Conclusion: The Truth About Unit Economics of Quick Commerce
The unit economics of quick commerce is the real engine behind 10-minute delivery models. Speed, branding, and funding may drive growth initially, but only disciplined cost control, margin optimization, and operational density ensure survival.
From my experience in retail and last-mile operations since 2013, sustainable quick commerce depends on:
- Zone-level profitability
- Delivery density
- Inventory discipline
- Margin mix optimization
- Rider productivity
The future of quick commerce belongs to operators — not marketers.
5 thoughts on “Quick Commerce Unit Economics in India (2026): Delivery Cost Per Order, AOV, CAC & Margins — Full Breakdown”